Climate and Weather Charts
Stockholm Arlanda Airport (ARN)
(Stockholm, Sweden)

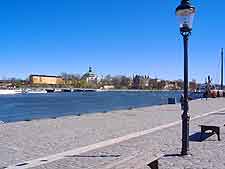
Stockholm features a continental climate and has long been on of Sweden's most important and popular cities. Located on the south-eastern edge of Sweden, the city of Stockholm enjoys a picturesque waterfront setting next to the Baltic Sea.
The summer climate in the Stockholm area is warm to hot, with temperatures averaging around 20°C / 68°F between July and September, peaking higher on occasion. Stockholm's summers offer long periods of daylight, which often last for more than 18 hours. As October arrives a definite nip can be felt in the air and by the end of the month, daytime temperatures have dropped to around 7°C / 45°F.
The winter months of December, January and February can feel bitterly cold by both day and night, with daytime temperatures hovering around freezing, dropping considerably at night. Heavy frosts can be expected at this time of the year in Stockholm, together with snow, which is often quick to settle. The average annual daytime temperatures in Stockholm are around 10°C / 50°F.
Climate Description: Continental climate
Stockholm Arlanda Airport (ARN) Location: Northern Hemisphere, Sweden
Annual High / Low Daytime Temperatures at Stockholm: 21°C / 0°C (70°F / 32°F)
Average Daily January Temperature: 0°C / 32°F
Average Daily June Temperature: 20°C / 68°F
Annual Rainfall / Precipication Stockholm at Airport (ARN): 494 mm / 20 inches
Stockholm Arlanda Airport (ARN):
Climate and Weather Charts
Temperature Chart |
| Temperatures |
Jan |
Feb |
Mar |
Apr |
May |
Jun |
Jul |
Aug |
Sep |
Oct |
Nov |
Dec |
Average |
Maximum
Celcius (°C) |
0 |
0 |
3 |
8 |
16 |
20 |
21 |
20 |
15 |
9 |
5 |
0 |
10 |
Minimum
Celcius (°C) |
-3 |
-4 |
-2 |
1 |
6 |
10 |
12 |
12 |
8 |
4 |
1 |
-2 |
4 |
Maximum
Fahrenheit (°F) |
32 |
32 |
37 |
46 |
61 |
68 |
70 |
68 |
59 |
48 |
41 |
32 |
50 |
Minimum
Fahrenheit (°F) |
27 |
25 |
28 |
34 |
43 |
50 |
54 |
54 |
46 |
39 |
34 |
28 |
39 |
Rainfall / Precipitation Chart |
| Rainfall |
Jan |
Feb |
Mar |
Apr |
May |
Jun |
Jul |
Aug |
Sep |
Oct |
Nov |
Dec |
Total |
| Rainfall (mm) |
30 |
25 |
25 |
28 |
33 |
43 |
64 |
66 |
48 |
51 |
43 |
38 |
494 |
| Rainfall (inches) |
1.2 |
1.0 |
1.0 |
1.1 |
1.3 |
1.7 |
2.5 |
2.6 |
1.9 |
2.0 |
1.7 |
1.5 |
20 |
Seasonal Chart |
| Seasons |
Average
Temp
(Max °C) |
Average
Temp
(Min °C) |
Average
Temp
(Max °F) |
Average
Temp
(Min °F) |
Total
Rainfall
(mm) |
Total
Rainfall
(inches) |
| Mar to May (Spring) |
9 |
2 |
48 |
35 |
86 |
3 |
| Jun to Aug (Summer) |
20 |
11 |
69 |
53 |
173 |
7 |
| Sept to Nov (Autumn / Fall) |
10 |
4 |
49 |
40 |
142 |
6 |
| Dec to Feb (Winter) |
0 |
-3 |
32 |
27 |
93 |
4 |
 Stockholm features a continental climate and has long been on of Sweden's most important and popular cities. Located on the south-eastern edge of Sweden, the city of Stockholm enjoys a picturesque waterfront setting next to the Baltic Sea.